Overview
What is Recursive Data?
I am sure you must have come face to face with this challenge called Recursive Data if you have to deal with databases. Hierarchical data which defines the level of association with a defined relationship ca be called recursive in nature. A typical example would be to take Accounting Application Database which has a table called ChartOfAccounts, the Primary Key “Account_Id” will have foreign key relationship with another column called “Reporting_Account_Id”. Another example is the one which I am using in this article is that each Employee has a Manager assigned.


Let's wear our Report Writing hat now…
When I look at different reporting engines out there in market, the underlying concept remains very much same; I am talking about header, footer, data region, data grouping, summary etc. So, even if you have not yet exposed to reporting services, don't worry if you have working knowledge of any reporting engine, you will not have much difficulty to grasp the concept laid down in this article.
With this article I would also like to show the reader how reporting services can be used with smart client windows forms application in a client environment
I assume the reader of this article is comfortable using Visual Studio 2005, C#, Sql Server 2000 and Windows Forms. Article is not at all a "Reporting Services 101", hence I will assume that you will try to play with attached code and figure out secrets hidden with it.
Implementing reporting services into smart client is like 1.2.3…
- Create a DataSet
- Create Report
- Use Preview control to generate report with ADO.NET code interface
1. DataSet at your service
In order to create a dataset, just click Add New Item from Solution Explorer. Select DataSet from Visual Studio installed templates and give it a proper name. After Dataset is created, open it in a designer window and add a DataTable to it. After you have added DataTable add required columns to it, in this example I have three columns added, namely, EmployeeName, EmployeeID and Reports_to, please make sure to set the DataType property of each column to String, Int32 and Int32 respectively.
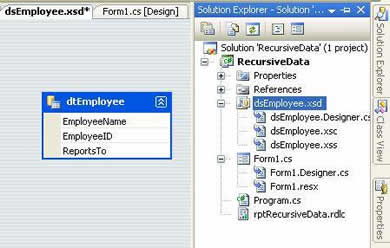
The DataSet should typically look like the above image. Now that we have our DataSet ready, you will shortly see a fun way to fill it using a new technique introduced in ADO.NET of using a SqlDataReader to Fill a Dataset (I guess my telepathy worked here tooJ).
2. Report Design
As we did with DataSet, just click Add New Item from Solution Explorer. Select Report from Visual Studio installed templates and give it a proper name. As I clarified earlier, I am not going into details for each and every control/elements of Report Designer; instead I will only point you to important location which needs attention in order to create Report which is using recursive data.
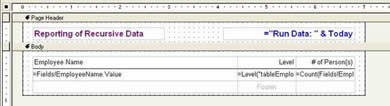
As you can see in the above image, this is how my reports look like in designer. Typical of report writing tool, reporting services also have interface where you can define header and footer to begin with and move on to report body etc. In the header section I have the Report Title (Magenta color) and Run Date (Blue color).
The most interesting part which I felt is the Body section, also called data region. Data region allows you to put several new exiting controls which basically decide how the data will be outputted. I have used "Table" control here which comes with ready header and footer for it when placed on designer surface for first time.
TextBox contol is used heavily to display information, if you look at the image you can see that I just placed a textbox control and simply typed the report title inside. When it comes to specify expression, all you have to do is start with "=" sign in front. You can check the Run Date example, in which I am concatenating string "Run Date" and VB.NET function "Today" to return current date.
After putting all the required control on the designer surface and making sure the layout meets out taste, it is time to spell the magic beans which will automatically handle the recursive nature of data and manage hierarchy level etc.
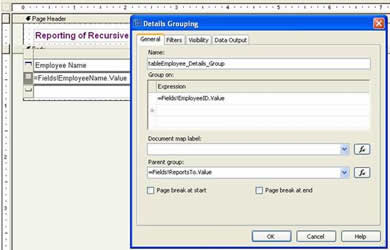
The trick is to put the grouping on detail section (make sure to select detail band and right click to access group menu choice), by specifying group on "EmployeeID" and parent group "ReportsTo" as per image mentioned below:
Report writer has useful inbuilt function like "Level", which returns the current level of depth in a recursive hierarchy.
For next output column in report Level, we will specify following expression:
=Level("tableEmployee_Details_Group") + 1
Level function return integer starting with 0 for fist level; hence I have added a 1 to end result here. So, in our example employee "Andrew Fuller", is topmost level, you can easily use function like Switch() or IIF() to take this level number and substitute with something like "CEO", "General Manager" etc.
The third and last column in report displays the count of all the employees who are reporting to given employee record. The following expression does the trick for us:
=Count(Fields!EmployeeID.Value, "tableEmployee_Details_Group", Recursive) - 1
For both the expression "tableEmployee_Details_Group" is used as reference name to group definition which we applied on detail band of data.
Did you also noticed on interesting thing about the Hierarchical formatting of EmployeeName in report output? This is also done fairly easily with following expression which you need to specify in Padding->Left property:
=Level("tableEmployee_Details_Group") * 20 & "pt"
Based on each incremental level it will add 20 pt to left side of EmployeeName and the output will look like a try structure.

 I started to code in 1990 using C and GW basic, then moved to 4GL world with DBIII, Clipper and FoxPro etc. and continued till I found and hooked to MS goody bag Visual Basic. For last four years, I am working extensively on .NET technologies and scripting both VB.NET and C#. My ideal choice of database is SQL Server; however, I do interact with Oracle when required. I have worked on all sort of Business applications, but my ideal project would be anything which has some Financial part associated with it, I wish I can put a Balance-sheet report in all the project I do… I also teach .NET related technologies as part-time faculty with local community college and try to help share my knowledge with others.