App Connect Charts Support
Powerful data visualization
There is a brand new and powerful way to visualize data in a couple of minutes with awesome types of charts! It’s called App Connect Charts.
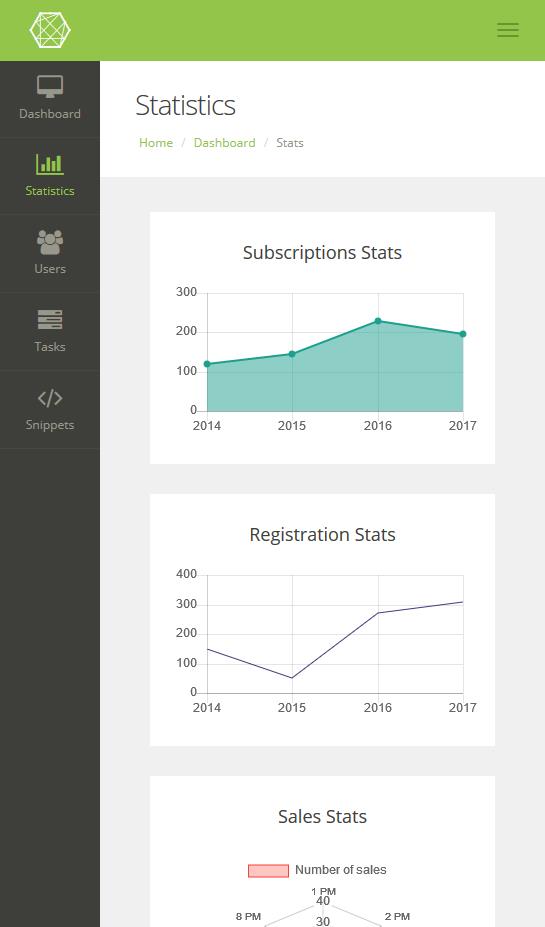
Line, bar, radar, pie, polar area, horizontal bar, doughnut or area graphics are available for best experience and clear data presentation. That will make every data dashboard, a simple illustrated article or just an interactive application really beautiful and greatly UX optimized!
Try mixing several types of charts and the extension will provide a visual distinction between different datasets.
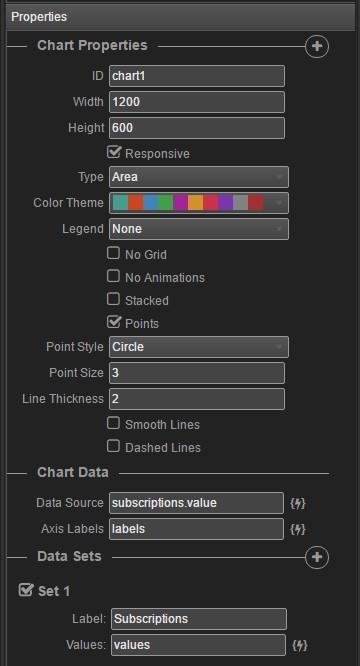
Use every database of JSON to import data, set your preferences from the App Connect Panel and you’re ready – App Connect will even update your data live with animations if changes have been made. The extension will scale the charts perfectly to any device or display size and will not slow down your website!
From professionally looking presentations to business and scientific reports – it’s all possible. Bring awesome visual value to your raw data with App Connect Charts!
George Petrov
 George Petrov is a renowned software writer and developer whose extensive skills brought numerous extensions, articles and knowledge to the DMXzone- the online community for professional Adobe Dreamweaver users. The most popular for its over high-quality Dreamweaver extensions and templates.
George is also the founder of Wappler.io - the most Advanced Web & App Builder


