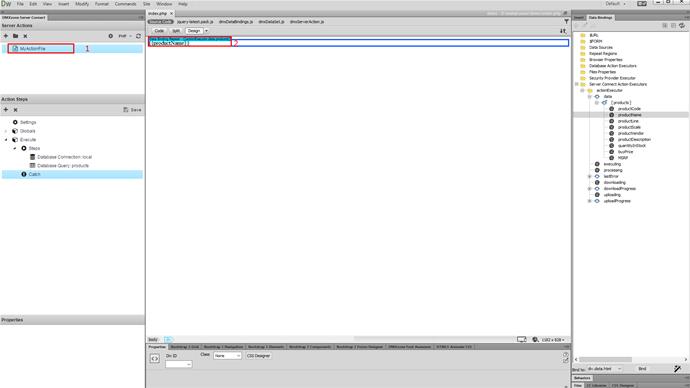
We will show you how to debug problems, related to your server actions. We created a server action, which contains a database connection and a query (1). We list our records into a repeat region on the page. So let's preview the results in our browser (2).
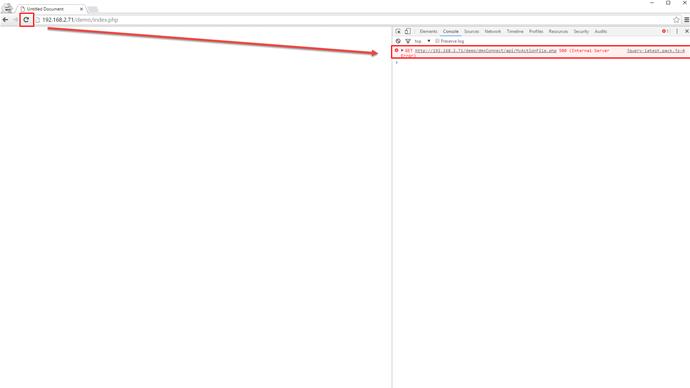
It seems we have some problem - nothing is being displayed on our page, and we've set everything up as shown in the tutorials. So - where is the problem? What to do now? The best thing you can do in such situation, is to press F12 in order to open, the browser's developer tools. Then, with the developer tools open, reload the page. If there is an error, you will see it under console tab, of the developer tools. In our case this is the most common error that you can see here internal server error 500. This error can be caused by multiple reasons. Click the action file, which is related to the error.
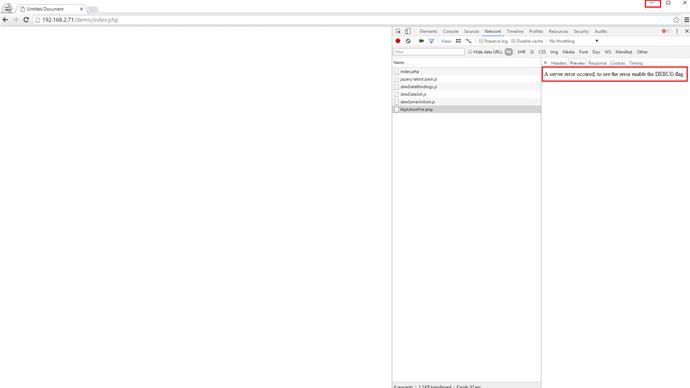
Then you will see a message, saying that a server error occured and you should enable the debug flag, in order to see it. Let's go back to dreamweaver.
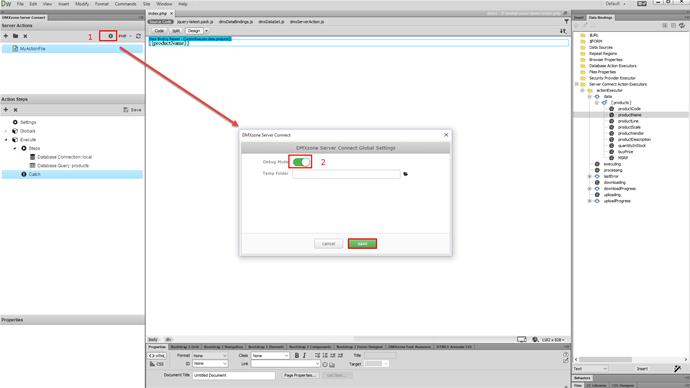
Open the Server Connect settings button (1). And enable the debug mode (2). Then, save the settings.
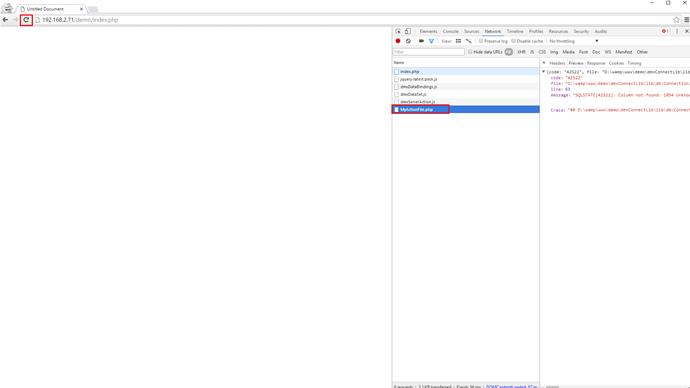
Go back to your browser, and refresh the page. Click the action filre, related to the error, in the developer tools panel. And, now - you see the exact error, explaining why isn't your page displaying any data, or why isn't your server action running.
In our case, you see that we are trying to work, with a column, which doesn't exist in the database. Now, we know what the error is, and we can fix this easily,by checking our database and our query. Please, make sure to enable debug mode, and if possible copy the error message, displayed in the developer tools console, when contacting our support. This will help us quickly isolate and fix, the issues you are having.

Comments
Be the first to write a comment
You must me logged in to write a comment.